Key Takeaways
Dataset lineage shows how data moves between major assets like tables, dashboards, and reports, while field lineage traces transformations at the column or metric level. Both are computed through SQL parsing, metadata extraction, and BI tool APIs. Together, they give full visibility into the data lifecycle—essential for governance, troubleshooting, and self-service analytics.
Understanding how data flows—from raw ingestion to visualization—is essential for building trustworthy analytics. That’s where data lineage comes in. But not all lineage is created equal.
In this article, we explore two key types of lineage—asset/object lineage and field lineage—and explain how they’re computed. Each type operates at a different level of granularity and serves a distinct purpose in your data environment. Understanding both is critical for anyone working to scale transformation, enforce governance, or support self-service analytics.
What is dataset lineage?
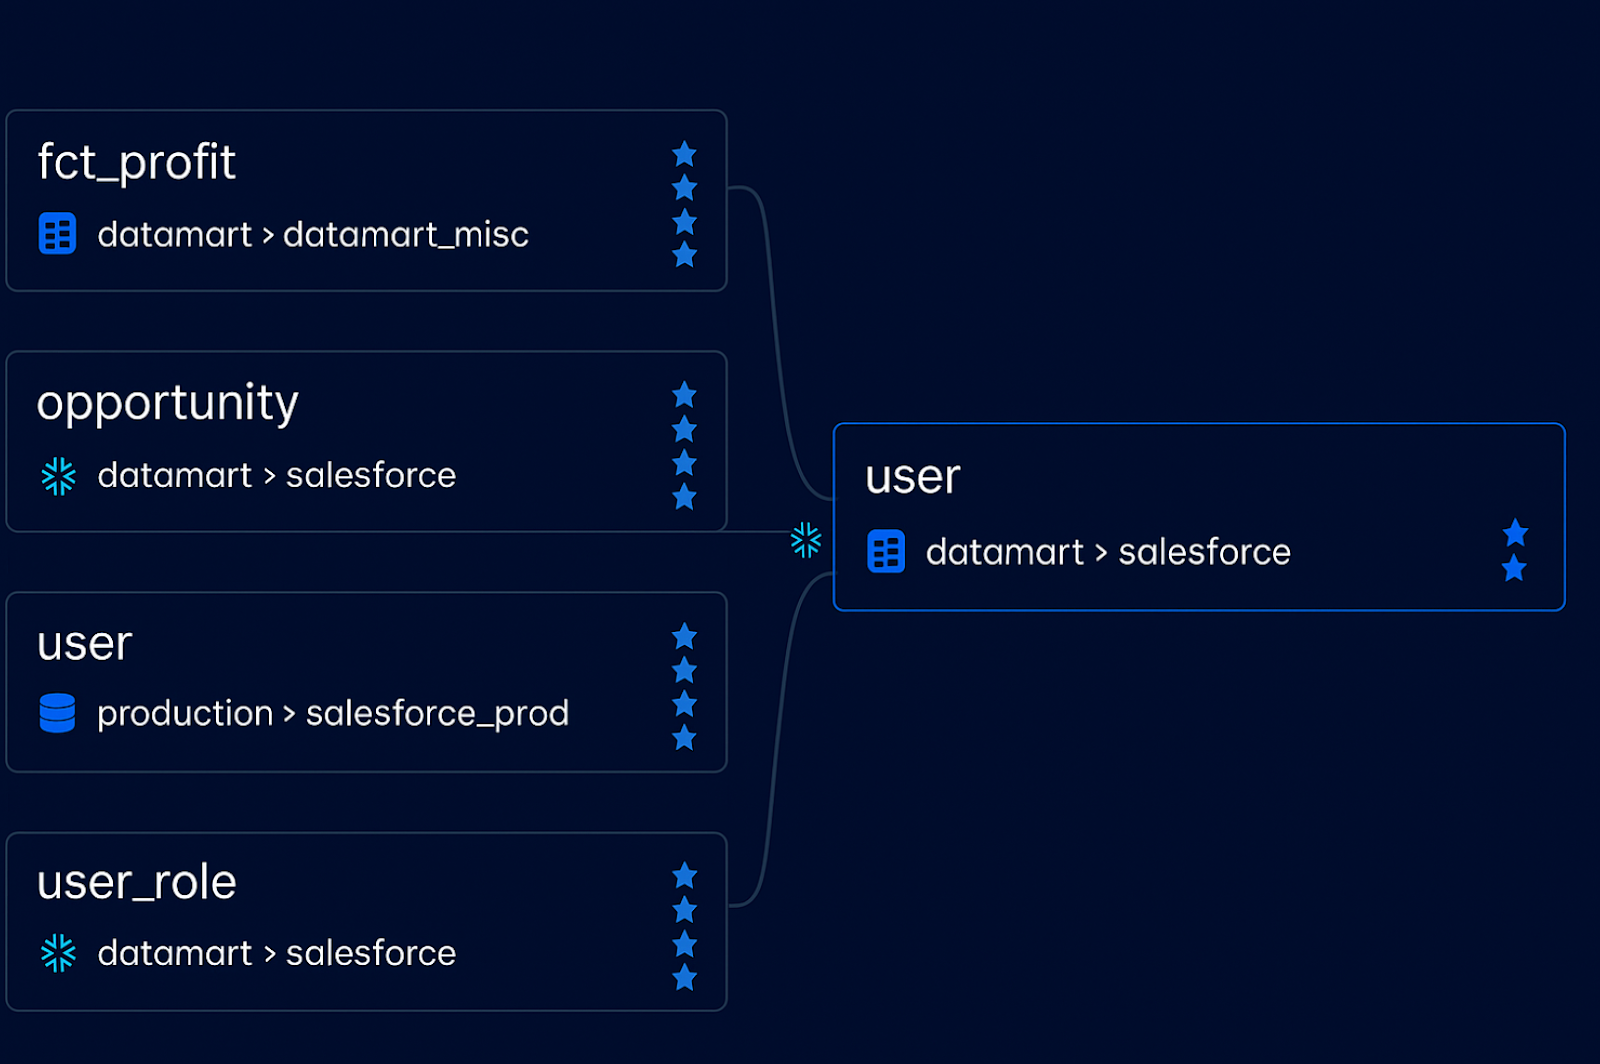
Dataset lineage shows the high-level flow of data between major objects in your data stack—such as tables, dashboards, and reports. It’s often the first step teams take when mapping their data pipelines.
Rather than tracing column-level dependencies, dataset lineage focuses on relationships between assets: which tables feed into which dashboards, or how one table is derived from another. Because it operates at a broader scope, it’s easier to compute and interpret.
What are the core types of dataset lineage?
We typically group dataset lineage into three patterns:
- Table-to-table lineage: How source tables are transformed into derived or aggregated tables.
- Table-to-dashboard lineage: How warehouse tables power visualizations.
- Dashboard-to-dashboard lineage: How BI components are nested or reused within tools.
Let’s break them down.
How is table-to-table lineage computed?
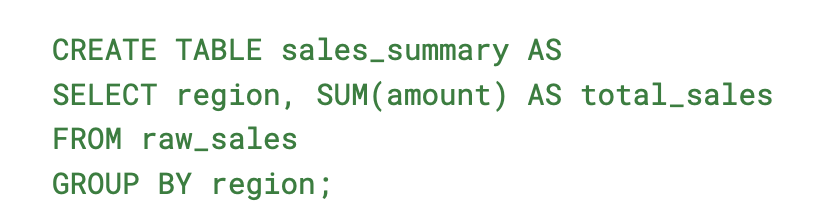
Table-to-table lineage is derived from analyzing SQL logic—specifically how tables are created, joined, or transformed. This computation hinges on parsing SQL statements such as CREATE TABLE, INSERT INTO, or SELECT INTO.
The lineage engine identifies source tables from FROM and JOIN clauses and maps them to destination tables in the output.
For example, a query that creates an aggregated_sales table from a raw_sales table using a SELECT … GROUP BY statement would establish a lineage link between the two. This allows data teams to trace transformation logic, pinpoint dependencies, and plan changes without breaking downstream jobs.
- Coalesce Transform automatically parses SQL logic as developers build transformations. See how column-aware lineage works.
How do you compute lineage between tables and dashboards?
When data moves from the warehouse into a BI tool, we shift from SQL lineage to application-level lineage.
In tools like Tableau, dashboards often connect to tables via custom SQL or semantic layers. Parsing those queries lets you link tables to dashboard elements. But when dashboards are built with drag-and-drop interfaces, you’ll need to rely on the BI tool’s API.
The process typically looks like this:
- Extract metadata from the BI tool via API.
- Identify data sources used in each dashboard.
- Map relationships between tables and visual elements.
- Create lineage links showing which tables power which dashboards.
This gives business users confidence in what they’re seeing—and helps data teams troubleshoot issues faster.
What about dashboard-to-dashboard lineage?
Some dashboards are composed of other dashboards or “cards.” This nested structure is common in tools like Metabase, Power BI, and Looker.
To capture lineage here, you need to:
- Query the BI tool API to understand composition.
- Translate dashboard relationships into data flow (e.g., card → dashboard).
- Align lineage representation with how end users consume data.
- While often overlooked, this lineage helps you understand how insights are built—and how they may change when upstream data is modified.
What is field lineage?
Field lineage (also called column-level lineage) offers a more detailed view of how individual data points move and transform. While dataset lineage helps map flows across your ecosystem, field lineage helps you answer: How exactly is this metric calculated?
There are three key patterns to know:
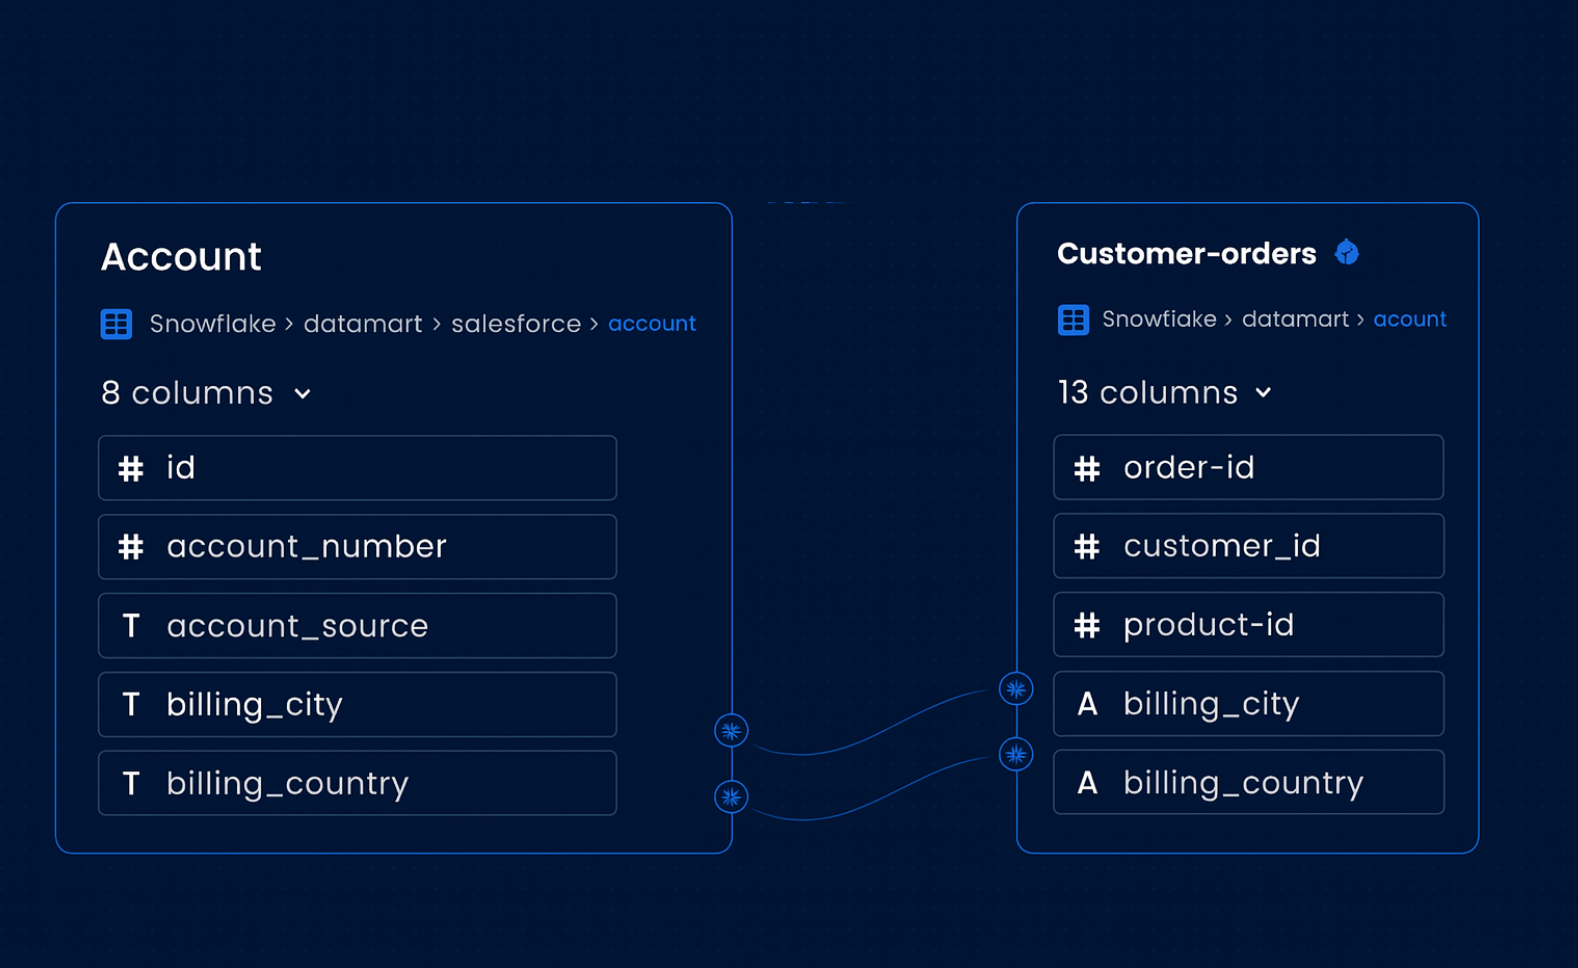
- Column-to-column lineage: How fields in one table are derived from another.
- Column-to-field lineage: How warehouse columns connect to visualization fields.
- Field-to-field lineage: How fields in dashboards relate to one another or to calculated metrics.
How is column-to-column lineage traced?
This is the most granular and technically complex form of lineage.
It requires parsing SQL queries to understand how each output column is derived from input columns. This involves:
- Identifying destination columns (e.g., SELECT column1 AS total_sales)
- Mapping source columns from the FROM, JOIN, and SELECT clauses
- Handling logic in subqueries, CTEs, unions, and aggregations
Here’s an example:
In this case:

This kind of lineage is essential for debugging transformation errors and understanding metric definitions.
- Want to see how Coalesce handles column-aware logic across nodes?
How do you map column-to-field lineage?
Column-to-field lineage connects data in your warehouse to what users see in dashboards. It tracks how columns are pulled into BI tools—either through SQL queries or semantic layers—and how they’re represented visually.
If your BI tool uses direct SQL, lineage is extracted from the query. If not, it’s typically computed through API inspection.
For example, if Tableau uses the column sales_table.sales_amount to populate a Total Sales field in a dashboard, the lineage would be:
sales_table.sales_amount → Total Sales (Tableau Dashboard)
This linkage is essential for data stewards and business users who want to trace insights back to their origin.
How is field-to-field lineage built?
Field-to-field lineage exists within the visualization layer. It shows how one field depends on another, such as when a calculated metric like Profit Ratio = Revenue / Cost is derived inside a workbook.
Each BI tool has its own method for storing and representing this logic:
- Looker: Defined via LookML files. Lineage is parsed by analyzing how explores and fields inherit from each other.
- Tableau: Defined in workbook XML. Lineage is computed by parsing calculated fields and their dependencies.
- Capturing this level of lineage enables precise impact analysis—especially for power users and data engineers maintaining complex dashboards.
Why both types of lineage are essential for scalable data workflows
Dataset lineage and field lineage each play a distinct—but deeply interconnected—role in helping organizations understand, trust, and scale their data operations. It provides a high-level view of how data moves between core assets like tables, dashboards, and reports. It’s foundational for understanding pipeline dependencies, reducing duplication, and navigating change.
Field lineage zooms in on how individual data points are created and transformed—from raw source columns to calculated metrics in dashboards. This level of detail is critical for root-cause analysis, impact assessment, and regulatory compliance.
Both types of lineage are computed through a combination of SQL parsing, metadata extraction, and API integration—requiring tooling that can stitch together technical and business context.
Together, dataset and field lineage give your team full visibility across the modern data lifecycle. They form the backbone of responsible data governance, unlock true self-service analytics, and enable faster, more confident decision-making at scale.
Final thoughts
At Coalesce we bring these capabilities into one unified platform. Whether you’re building complex transformations, managing metadata, or enabling business users to explore trusted data, Coalesce provides column-aware lineage baked directly into your workflows.
- Explore how Coalesce combines transformation logic and data cataloging into a single interface—see our platform in action.
Frequently Asked Questions
Dataset lineage maps high-level flows between data assets like tables, dashboards, and reports, while field lineage traces transformations at the column or metric level.
It helps teams understand dependencies between major assets, troubleshoot pipeline issues, and maintain trust in analytics without diving into column-level detail.
Typically by parsing SQL queries (e.g., CREATE TABLE, SELECT INTO), analyzing joins, and extracting metadata from BI tools to show how tables connect to dashboards.
- Table-to-table lineage: Tracing transformations between tables.
- Table-to-dashboard lineage: Mapping warehouse tables to BI dashboards.
- Dashboard-to-dashboard lineage: Capturing nested or reused dashboards.